VCF to Lep-MAP
The following steps take a .vcf file with a full sib pedigree and turn it into a .linkage file for Lep-MAP.
The following steps take a .vcf file with a full sib pedigree and turn it into a .linkage file for Lep-MAP.
It is very easy to flip transpose a data frame in R.
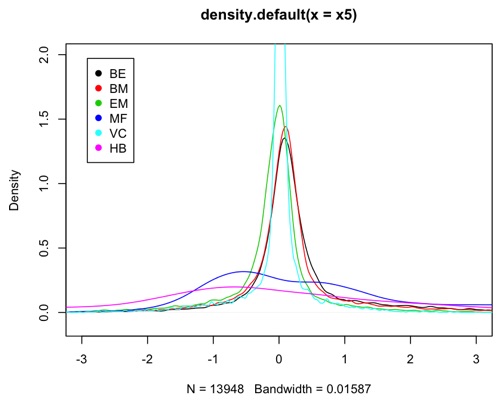
A density plot can be used to compare the distribution of different variables.
Sometimes a package is needed that is not part of the R installation. It is easy to install it, and all its dependencies.
To find out the version of all R packages used, which is useful to refer to in publications
It is easy to produce figures with multiple panels in R.
The antilogit value of a variable can. E useful in plotting.
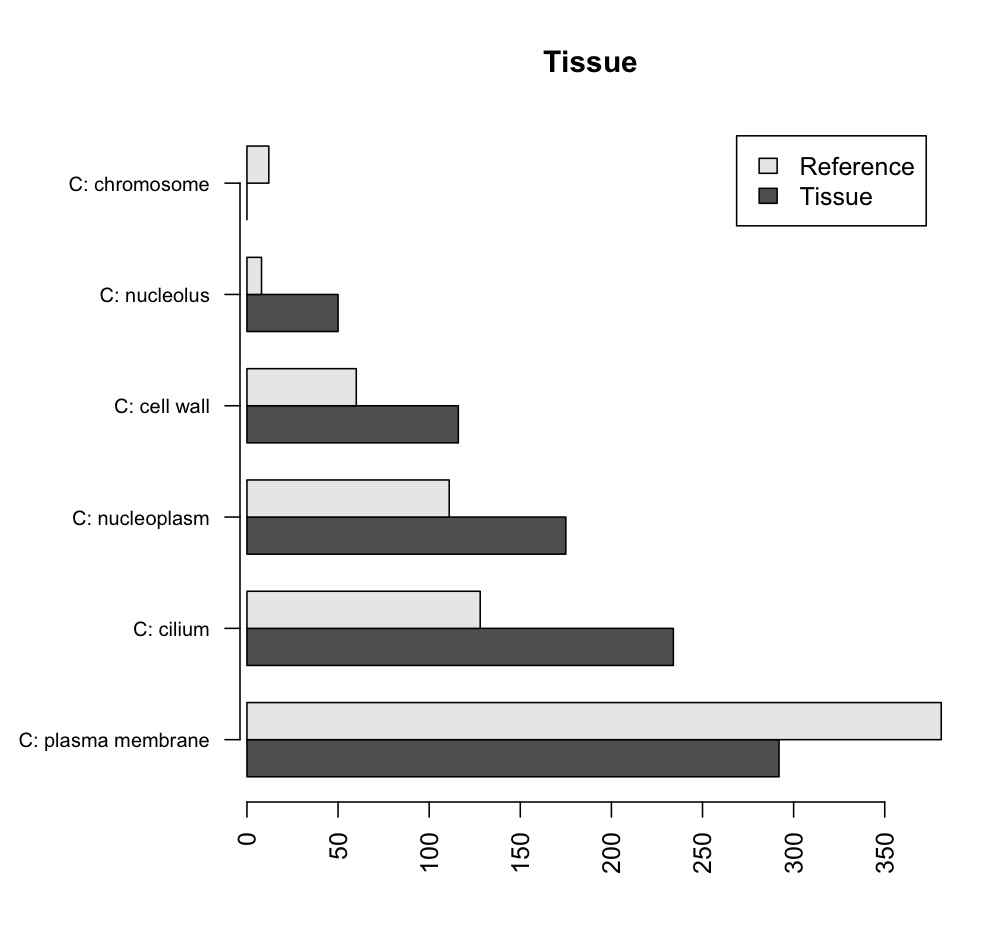
Barplots can be useful for comparing different treatments.