Boxplot
Boxplots allow to easily visualise factor levels within a variable

Boxplots allow to easily visualise factor levels within a variable
Notes on basic import and export in R.
Some quick ways to visualise new data.
You will often want to combine different datasets with a column in common. This is easy to do in R.
When you need to compare different data with very different value ranges.
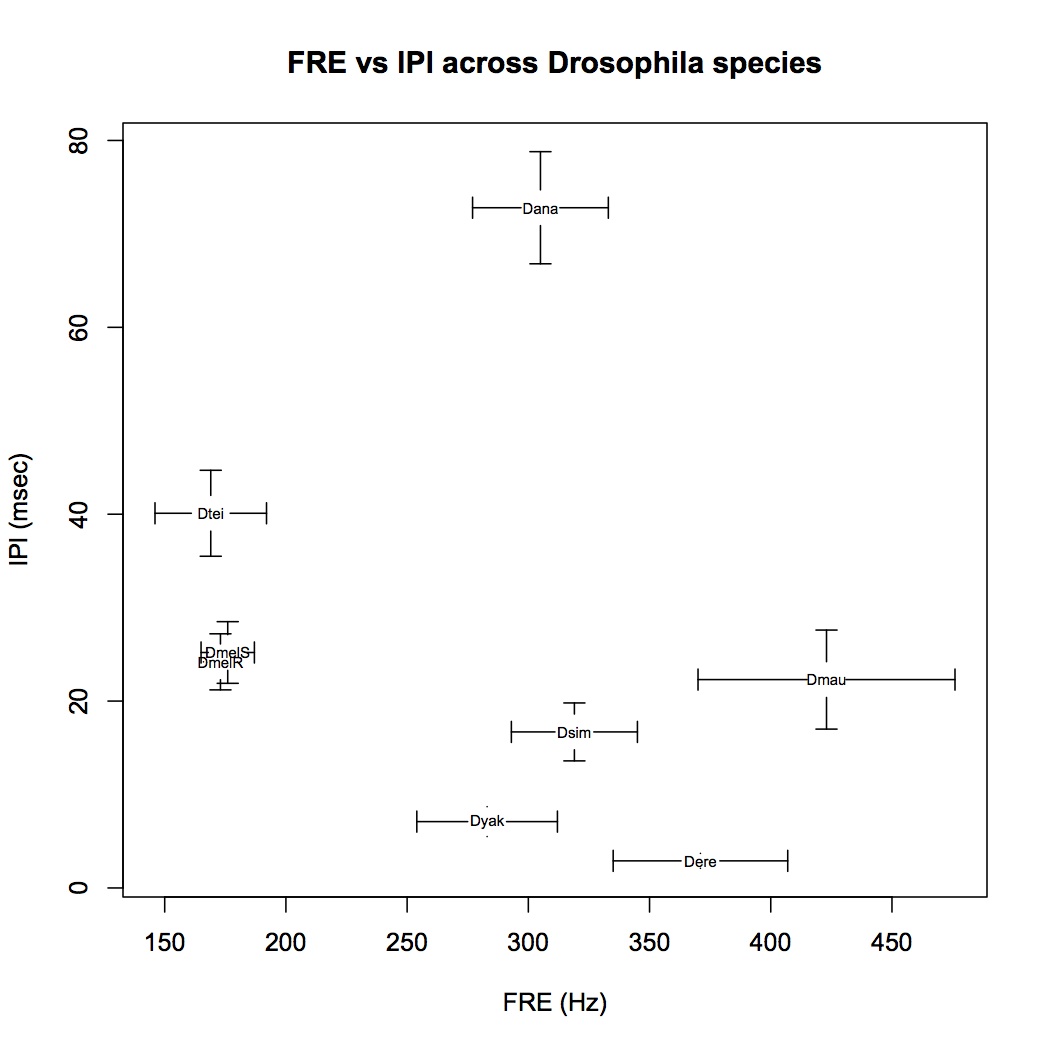
Here is how to plot the values of two traits, along with error bars for these values, to see if they overlap in different instances.
To change the name of a column in a data.frame
It is often necessary to replace values in a column in data.frame, for example NAs with 0s.
It is useful to save R graphics with code, so the file creation and naming can be automated.