Plot error bars
Here is how to plot the values of two traits, along with error bars for these values, to see if they overlap in different instances.
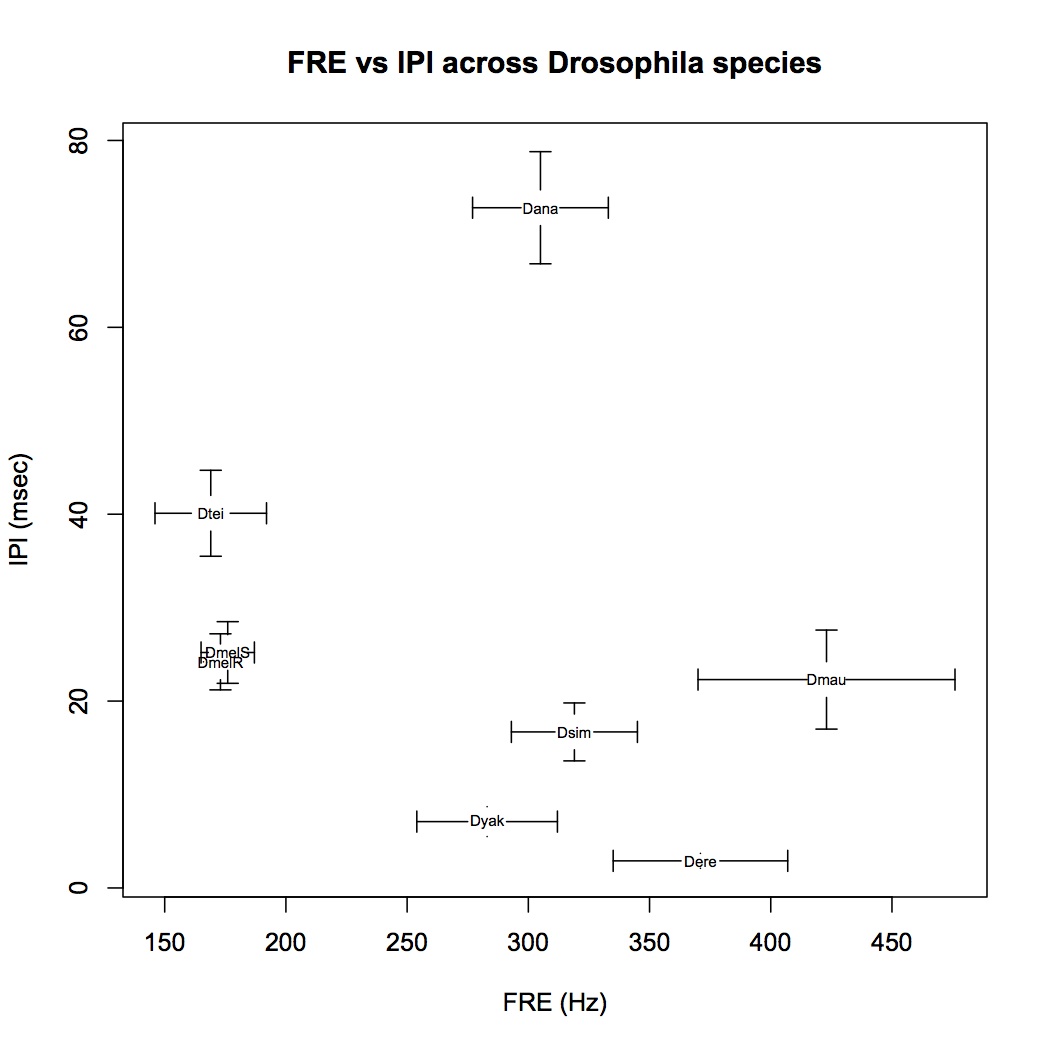
For example we'd like to see how species-specific two song characters are. The data come from Riabinina et al. They are song carrier frequency (FRE) and inter pulse interval (IPI) for various Drosophila species (including two populations for D. melanogaster).
If you don't have it already, install the gplots library and load it.
install.packages("gplots", dependencies=TRUE)
library(gplots)
Load the data. In the following example I am adding them manually.
FRE<-c(305, 371, 423, 173, 176, 319, 169, 283)
FREsd<-c(28, 36, 53, 7, 11, 26, 23, 29)
IPI<-c(72.8, 2.9, 22.3, 24.2, 25.2, 16.7, 40.1, 7.1)
IPIsd<-c(6, 0.8, 5.3, 3, 3.3, 3.1, 4.6, 1.6)
species<-c('Dana', 'Dere', 'Dmau', 'DmelR', 'DmelS', 'Dsim', 'Dtei', 'Dyak')
Finally, the plot code. Start by plotting the graph and y-error bars:
plotCI(FRE, IPI ,IPIsd, pt.bg=par("bg"),pch=NA, xlim=c(min(FRE-FREsd), max(FRE+FREsd)), xlab='FRE (Hz)', ylab='IPI (msec)', main='FRE vs IPI across Drosophila species')
Add the x-error bars:
plotCI(FRE, IPI ,FREsd, pt.bg=par("bg"),pch=NA, err='x', add=T)
Add the points for each species as text:
text(FRE,IPI,species, cex=0.6)
The final graph: